Diurnal
Rhythm Of
Air Pressure
our breathing planet.
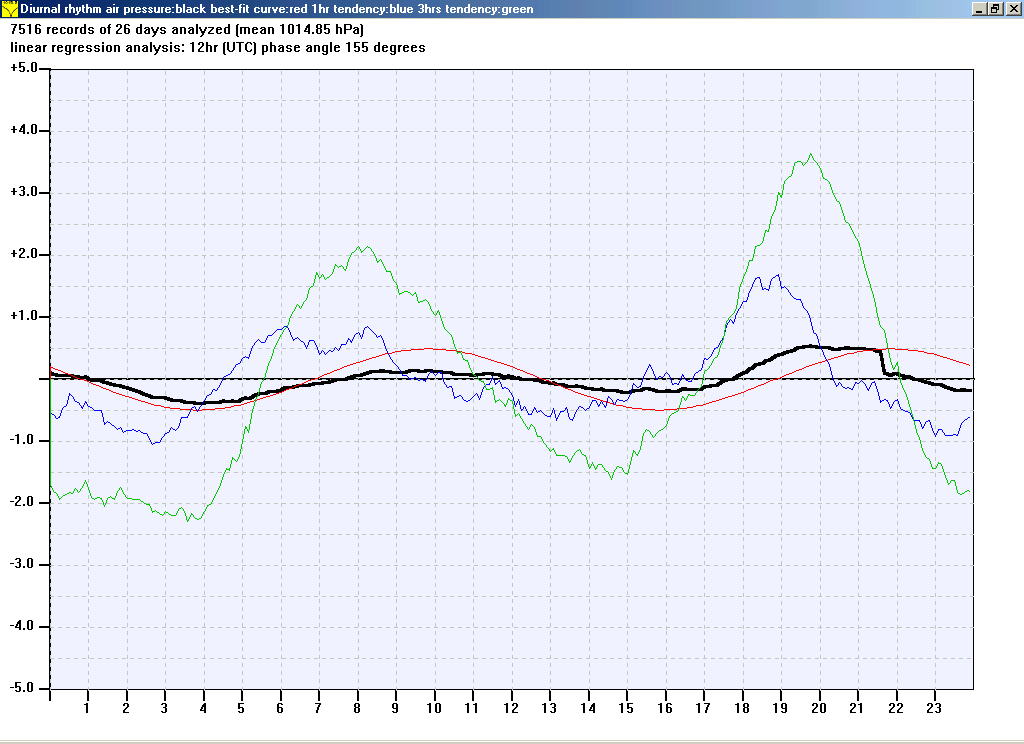
These curves show the diurnal rhythm of air pressure in our region (NW Germany Sylt island / North sea) august/september 2004. Time is UTC. Our local time is UTC + 1.

We used a linear regressionsanalysis (least square error) to calculate the best-fit sine curve and its phase angle (red). The blue curve corresponds to the one hour tendency and the green curve to the three hours tendency.
We had strong weather influences here.
A spectral analysis using the discrete Fourier analysis shows the
following curves:

The 12 hour peak is visible, but weak
because of strong weather influences. We will show here in the
future better results. .
Air pressure changes according to a
semicircadian (12 hr) rhythm and a superimposed circadian (24 hr)
rhythm. In our region in Northwest Germany the 12 hr rhythm is
far more important. The amplitudes are strongest at 0 degrees
latitude ( up to 5 hPa ) and are weak in polar regions. These
pressure variations are a function of the square of the cosine of
latitude.